Gallery
This section gives you a visual glimpse at the functionalities of the Time Series Viewer plugin
Multiple Map Views
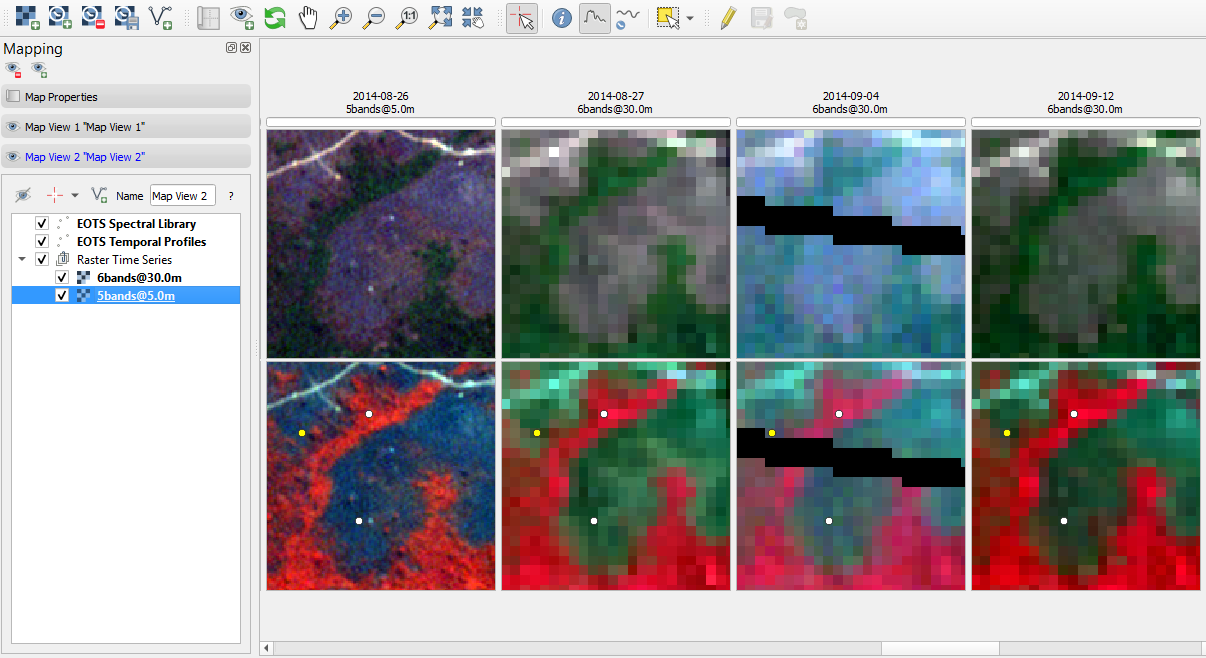
Visualize a time series in several map views, for example to show a different band combination or highlight additional layers
Temporal plots
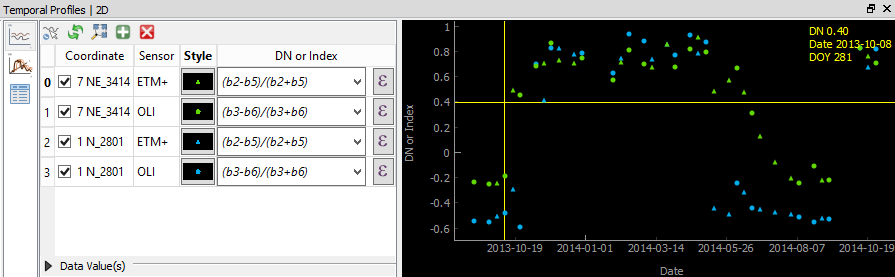
Visualize temporal profiles at selected (in the map canvas) or imported (from a shapefile) locations and transform the values on-the-fly for plotting
Spectral plots
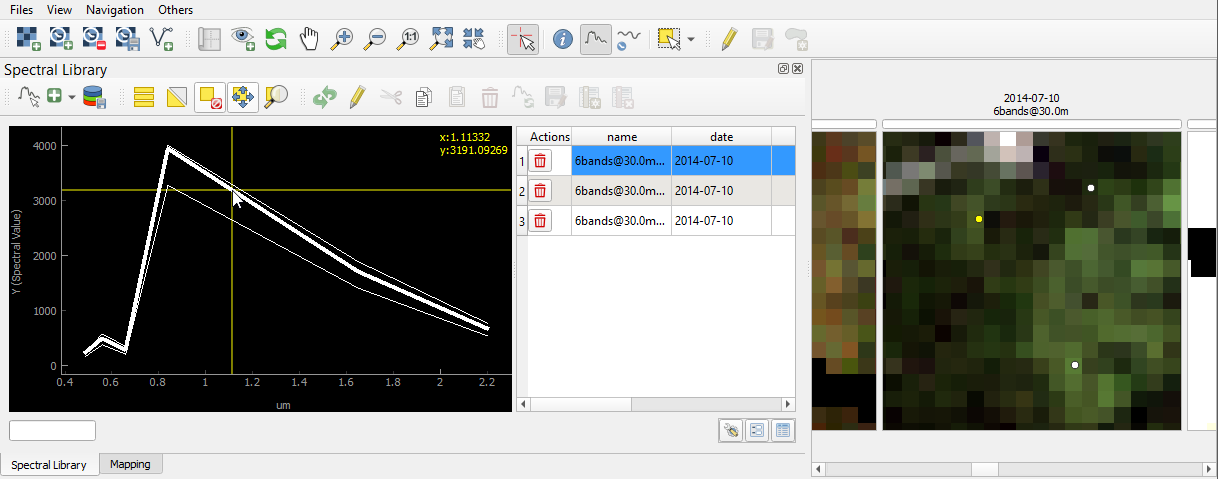
Visualize and manage spectral profiles in a comprehensive spectral library tool
Labeling
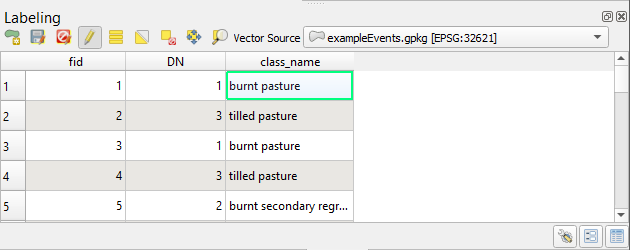
Label your time series using a vector dataset and interactively zoom/pan to selected features in the map canvas
Image crosshair

Detailed and fully customizable crosshair with pixel highlighting and scale bar