4. Time Series
The EO Time Series Viewer visualizes a time series of raster images which is shown in the time series panel. It can consist of raster sources that originate from different EO sensors, or products derived from such sensors. Each Time Series Sources linked to an Time Series Date. The time series panel can be used to control the visibility of single sources or entire time series date in the map visualization.

Fig. 4.1 Time series panel, showing a time series with raster sources from two different sensors.
4.1. Time Series Sources
A Time Series Source can be any raster source that (i) is readable by QGIS/GDAL and (ii) provides a timestamp.
To find a timestamp, the EO Time Series Viewer searches in following locations:
Location |
Description |
|---|---|
GDAL metadata |
|
ENVI header file (*.hdr) |
|
Filename |
Examples: |
Parent directory name |
Examples: |
QGIS Layer Properties |
Temporal properties, Fixed time range > Start date, see QGIS Raster Layer Properties |
If none of the locations described above returns works, an ISO 8601 timestamp may be added (i) to the datasourc uri, e.g. including it into the name of the source file or its parent folder, or (ii) adding it to the GDAL metadata:
# set timestamp to image
from osgeo import gdal
path = '/data/myimage.tif'
ds = gdal.Open(path)
assert isinstance(ds, gdal.Dataset)
ds.SetMetadataItem('ACQUISITIONDATETIME', '2024-03-02', 'IMAGERY')
ds.FlushCache()
del ds

# test if we can read the time stamp
from qgis.PyQt.QtCore import QDateTime, Qt
from eotimeseriesviewer.dateparser import ImageDateUtils
dtg = ImageDateUtils.dateTimeFromLayer(path)
assert isinstance(dtg, QDateTime)
print(dtg.toString(Qt.ISODate))
4.2. Sensors/Products
The EO Time Series Viewer assumes that images with the same spectral properties and pixel size have been created by the same sensor and therefore should be handled in the same way. For example, if you change the band combination and color stretch for a single Landsat image, you like to do this for all other Landsat observations as well, to allow for a comparison.
Therefore, each source image is automatically linked to a sensor, or more general spoken, an image product, e.g, *Landsat 8, Sentinel-2 or a one-band NDVI image derived from.
A sensor/product is characterized by the following attributes
Attribute |
Description |
|---|---|
|
number of bands |
|
pixel size in image x direction |
|
pixel size in image y direction |
|
optional, list of wavelength, one for each band |
|
optional, the wavelength unit, e.g. |
|
the sensor/product name. can be changed |
The sensors of the time series and their attributes are listed in the Sensor/Products panel, which also summarizes how many time series dates and time series sources relate to each sensor.
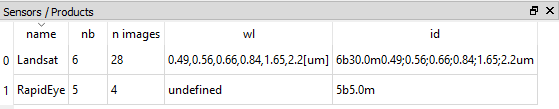
Fig. 4.2.1 Sensor/Products panel.
4.3. Time Series Dates
A time series date is a group source images that (i) belong to the same sensor, and, for the sake of visualization, (ii) have the same observation date.
Often source images have different time stamps, but we want to handle them as if they had the same timestamp. For example, the Sentinel-2 observations that have been recorded on the same day and the same orbit overpass may show a progressive increase in their time stamps. Using the EO Time Series Viewer with a Date-Time Precission of a “Day”, all observations from the same day will be linked to the same time series date and visualized in the same map canvas.
4.4. Time Series Panel
The Time Series Panel lists the individual time series dates and their time series sources.

Date corresponds to the image acquisition date as automatically derived by the EO TSV from the file name. Checking
 or unchecking
  the box in the date field will include or exclude the respective image from the display
Sensor shows the name of the sensor as defined in the :ref:` <>` tab
ns: number of samples (pixels in x direction)
nl: number of lines (pixels in y direction)
nb: number of bands
image: path to the raster file
You can add new rasters to the time series by clicking  .
Remove them by selecting the desired rows in the table (click on the row number) and pressing the
.
Remove them by selecting the desired rows in the table (click on the row number) and pressing the  button.
Tip
If you have your time series available as one large raster stack, you can import this file via
Tip
Click to load a small example time series.