Visual Changelog
Version 1.12
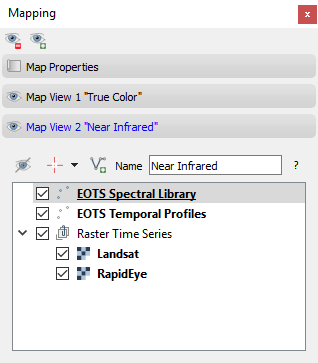
The TimeSeries tree view allows to change the visibility of single source image
The new context menu entry Add Product offers specialized methods to load source images.
Add Product > Sentinel-2 is used to load the sub-datasets of interest from Sentinel-2 products,
Add Product > Subdatasets generally allows to load subdatasets e.g. from HDF images.
Version 1.11
this version did not provide major visual changes (with except of less error messages)
Version 1.10
improved matching of source images to sensors: matching can be specified in the settings dialog. Sensor matching based on ground sampling distance + number of bands + data type and optionally wavelength and/or sensor name
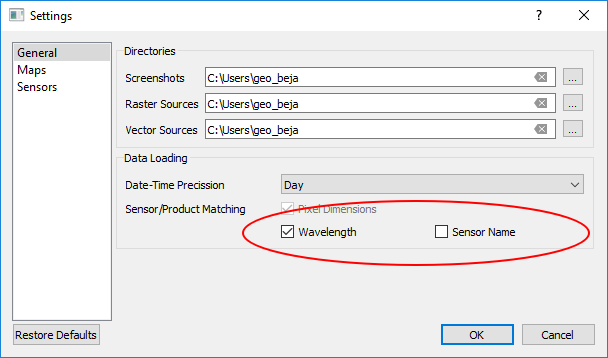
settings dialog allows to change the names of known sensors / image product specifications
fixed copying of layer styles to maps of same sensor and map view type
improved speed of mapping and layer buffering
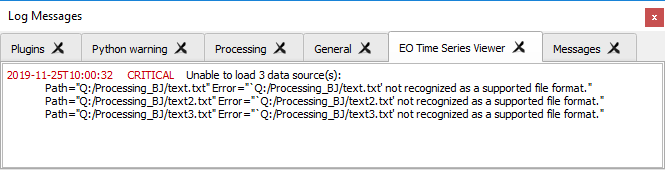
failed image sources are logged in teh EO Time Series Viewer log panel
Version 1.9
includes several smaller updates
fixed error ‘shortcutVisibleInContextMenu’ error that occurred with Qt < 5.10
enhanced wavelength extraction from GDAL metadata: wavelength can be specified per band
Version 1.8
updated spectral library module
fixed #104: error in case of wrong spatial extent
default CRS properly shown in map view settings
user-defined CRS visible
Version 1.7
increased contrast for default map view text
improved reading of wavelength information, e.g. from Pleiades, Sentinel-2 and RapidEye data
temporal profile plot: data gaps can be shown by breaks in the profile line, data source information is correctly shown for selected points only
current extent can be copied via MapCanvas context menu
fixed #102: move maps to date of interest selected in a temporal profile plot
Version 1.6
re-design of map visualization: faster and more compact, the number of maps is fixed to n dates x m map views
date, sensor or map view information can be plotted within each map and become available in screenshots
releases map layers that are not required any more
slider + buttons to navigate over time series
fixed preview in crosshair dialog
Version 1.5
closing the EO Time Series Viewer instance will release all of its resources
added “Lock Map Panel” to avoid unwanted resizing of central widget
fixed missing updates of time series tree view when adding / removing source images
map canvas context menu lists layers with spatial extent intersecting the cursor position only
fixes feature selection error
added quick label source image to label the path of raster layer
Version 1.4
adding vector layers with sublayers will add all sublayers
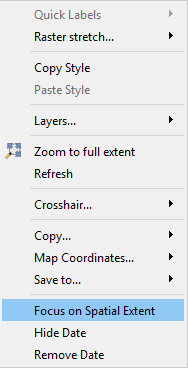
map canvas context menu “Focus on Spatial Extent” will hide maps without time series data for the current spatial extent
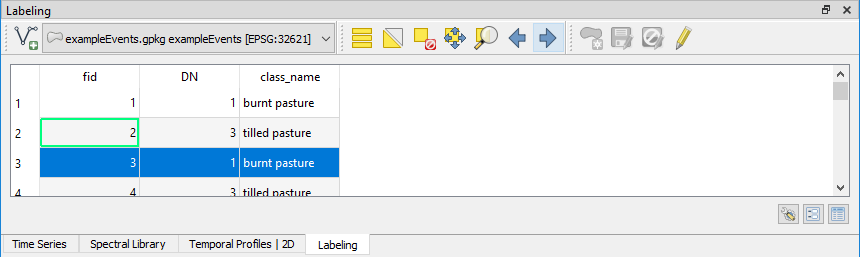
labeling dock allows to iterate over vector features. the spatial map extent will be centered to each feature (#26)
added several convenience function to TimeSeriesViewer object
fixed a bug that did not allow to create new polygon features
temporal profile visualization: fixed icons to preview selected plot style, coordinate described by “<fid> <name>”, e.g. “42 Deforested”, fixed plot style preview
updated SpectralLibraryViewer
fixed spelling error in stacked band input dialog
MapViews can add raster layers that have been opened in QGIS, e.g. XYZ Tile with OpenStreetMap data
Version 1.3
Bugfixes only
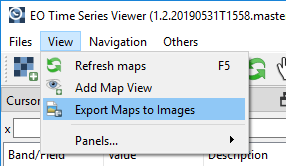
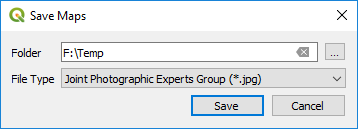
Version 1.2
Added menu option to export all maps as image files.
Fixes:
select Temporal Profile / Spectral Profile button activates the required map tools (#91).
map canvas context menu “copy to clipboard” options (#92).
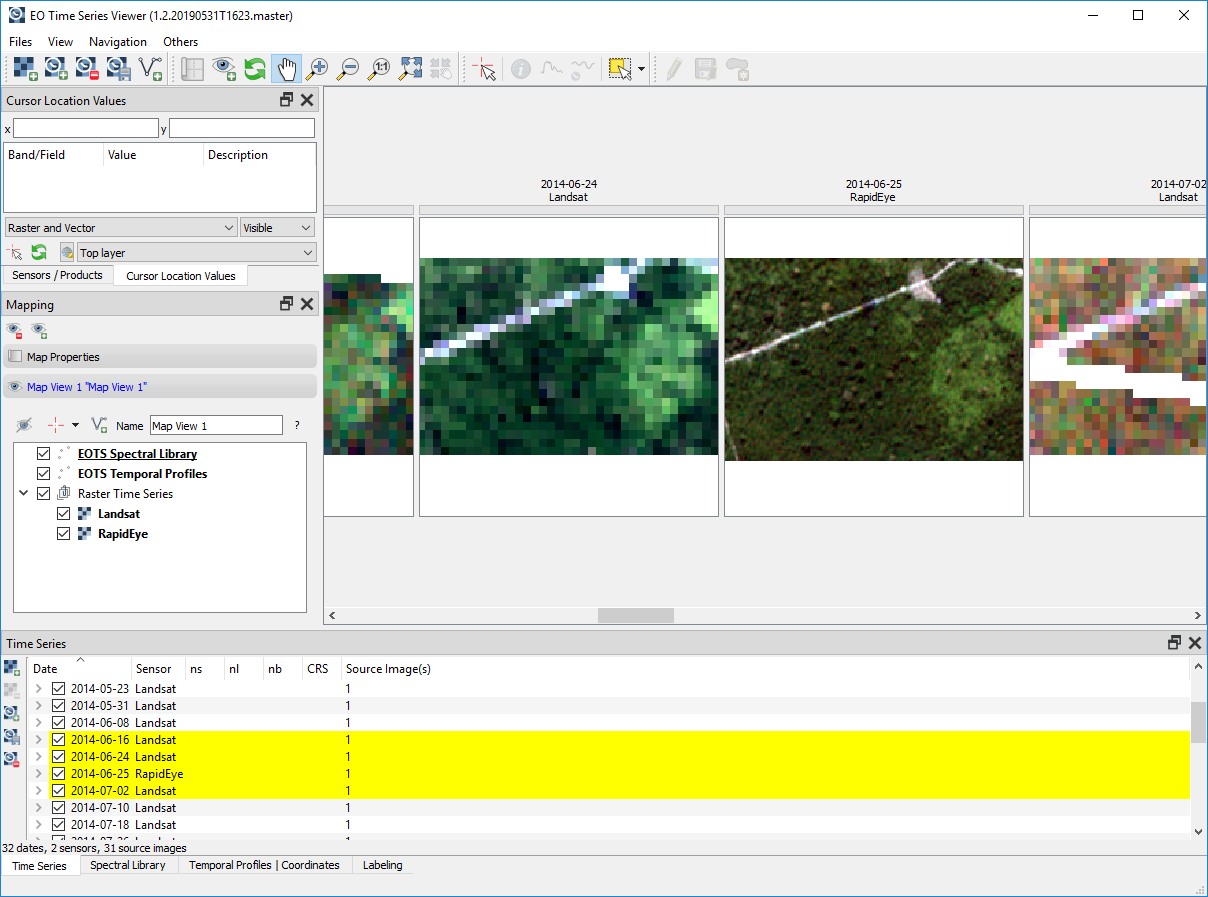
Version 1.1
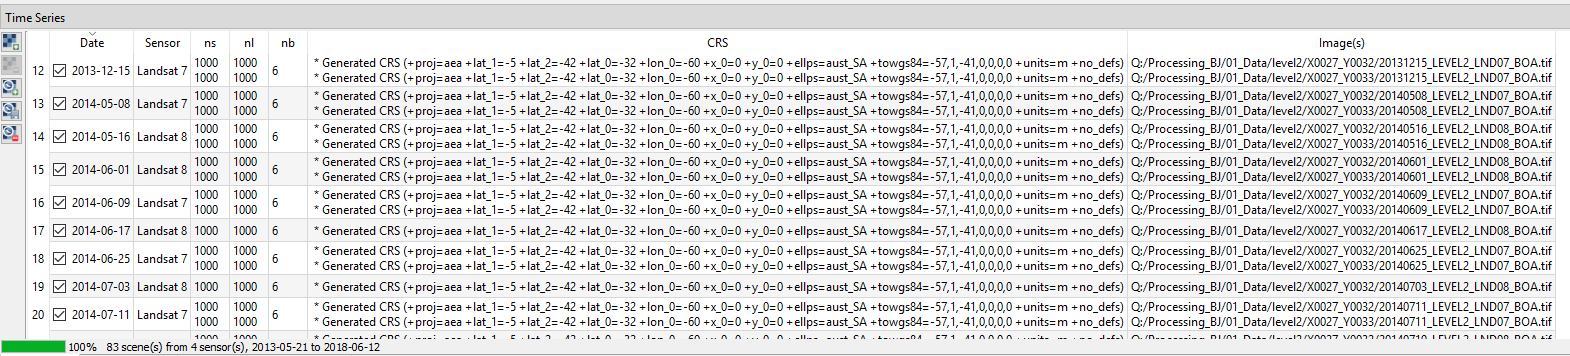
Time Series data sources are shown in a tree view, which improves the overview in case multiple source images exists per observation date.
Observation dates of visible Map Canvases are highlighted in the time series tree view.
Fixes:
Sensor raster layer properties can be opened from MapView layer tree (#87). Stats will be related to center mapcanvas.
StackedInputDialog, MapCanvas context menu, “Save Changes?” labeling dialog (#85),
remove temporal profile (#86), draw new feature error (#84), Crosshair button status (#90), and some more
Version 1.0
Quick Labeling
The map canvas menu entry “Set Quick Labels” can be used to write sensor/product, file and observations-date specific information into attribute fields of linked vector layers.
open the layer properties of the vector layer you like to label
edit the form attributes and use the EOTS Quick Label form to each layer fields, that you like to label automatically.
Each map canvas relates to a raster timeseries sensor/product and observation date. From that we can derive the following label information:
Information
Data Type
Example
Date
String
2014-04-01
DOY
Integer
Decimal Year
Double
2014.234
Sensor Name
String
Landsat
File Path
String
image/….
Labeling Dock
The Labeling panel can be used to modify vector layers. The editing process is similar to that known from the QGIS attribute tables.
Use the labeling panels combobox to select the vector layer you like to modify
Press the “Start Editing” button
Make your changes
Save your edits or reject them
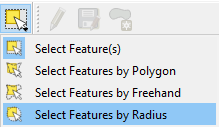
Toolbar

Old toolbar

New toolbar
The toolbar was enhanced with an button to import vector sources, to select, add and save vector features, and to synchronize the map canvas center with that of the QGIS main map canvas.
Map Views
The map view control panel has been reorganized based on the [QToolBox](https://doc.qt.io/qt-5/qtoolbox.html#details) widget. This way fix a couple of layout issues, where map view settings looked squeezed. Each Map View has now its own map layer tree to specify map layer visibility.
Time Series Model
The multi-sensor time series allows to add multiple images with same sensor properties and observation date.
Version 0.8
increased version to 0.8
added labeling panel
scheduled map canvas refreshes
multiple images per observationdata & sensor
fixed several bugs
uses QgsTaskManager for background loading
own QgsMapLayerStore to not mix-up with (main) QGIS layers
Version 0.7
Visualization of images with stacked temporal information (each band = one observation date)
Speclib I/O as CSV or ENVI-Spectral Library + CSV table for attributes
temporary VRTs now created in-memory (gdal VSI mechanism) instead in a disk temp path
- fixed bugs:
Spectral Library: profile coordinate now in center of map pixel (issue #66)
Save map canvas to clipboard
Width of plot lines now scale-independent (issue #64, QPen.setCosmetic(True))
adding fields to spectral library (issue #61)
Version 0.6
SpectralLibrary Module
now based on in-memory QgsVectorLayer
Locations and values of spectral profile can be exported as vector data set
Locations of spectral profiles can be rendered on MapCanvases
Temporal Profile Module
now based on in-memory QgsVectorLayer
Locations of temporal profiles can be exported as vector data set
Band values of temporal profiles can be exported as CSV file
Locations of temporal profiles can be rendered on MapCanvases
several bug fixes
Version 0.5 and before
increased version to 0.5
ported to QGIS 3, Qt5 and Python 3.6
improvements in temporal profile visualization
removed several bug
visibility of vector and raster layers can be toggled per map view
improved interaction between QGIS and EOTSV (Buttons to import/export spatial extent of map canvas or center)
2018-03-29 - improved definition of individual 2D / 3D charts per sensor & pixel-location - added based OpenGL based 3D plot features (axis, grids, labels) - changed name to “EO Time Series Viewer” (EOTSV)
- 2018-02-11
merged updates to temporal profile visualization, e.g. save temporal profiles, compare 2D profiles between different location, experimental 3D visualization
- 2018-01-31
added file filters for OpenFileDialog
- 2018-01-19
initialized Sphinx-based documentation
improved map visualization + map settings
- 2017-05-21:
many changes, done in development branch “develop”,
e.g: QGIS MapCanvases for interactive maps, temporal profiles, …
- 2017-02-14:
first setup for test users in the recent development branch