Features
This section gives you a visual glimpse at the functionalities of the EO Time Series Viewer.
Multiple Map Views

Fig. 1 Visualize a time series in several map views, for example to show a different band combination or highlight additional layers
Temporal profiles
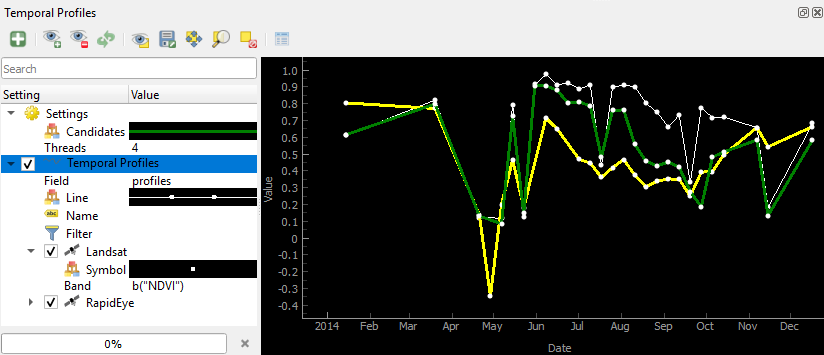
Fig. 2 Visualize temporal profiles at selected (in the map canvas) or imported (from a shapefile) locations and transform the values on-the-fly for plotting
Spectral profiles

Fig. 3 Visualize and manage spectral profiles in a comprehensive spectral library tool
Labeling
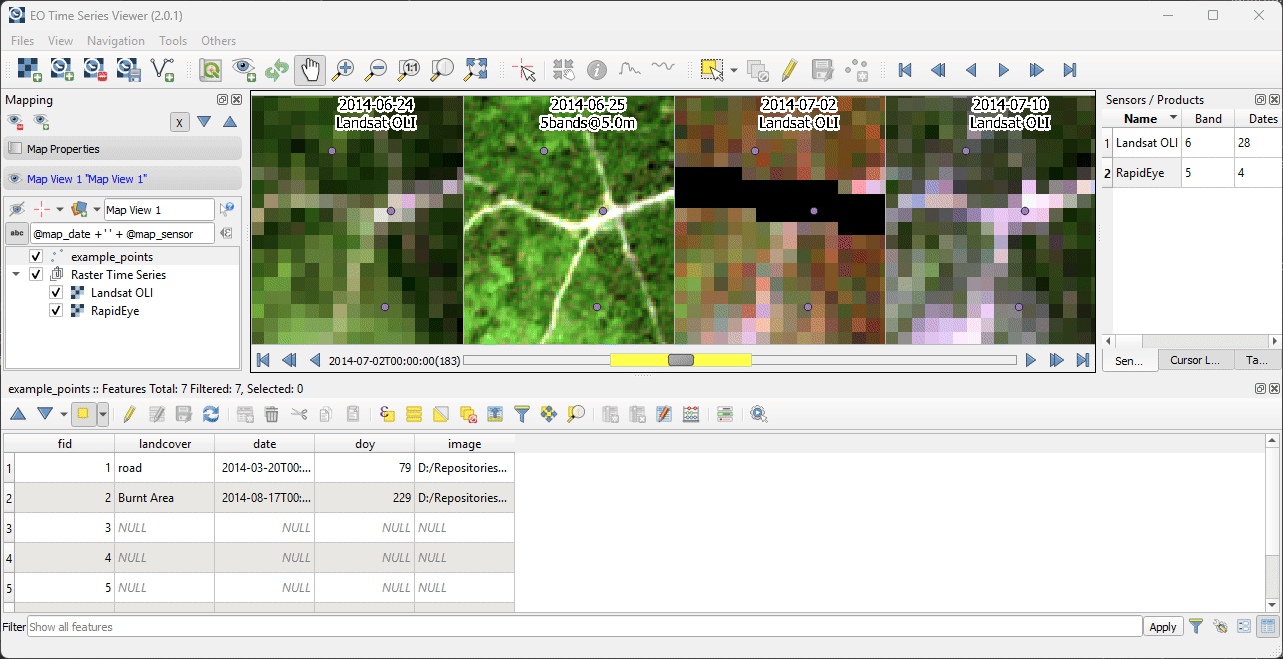
Fig. 4 Label your time series using a vector dataset. Use quick label shortcuts to write vector attributes and interactively zoom/pan to selected features.
Image crosshair
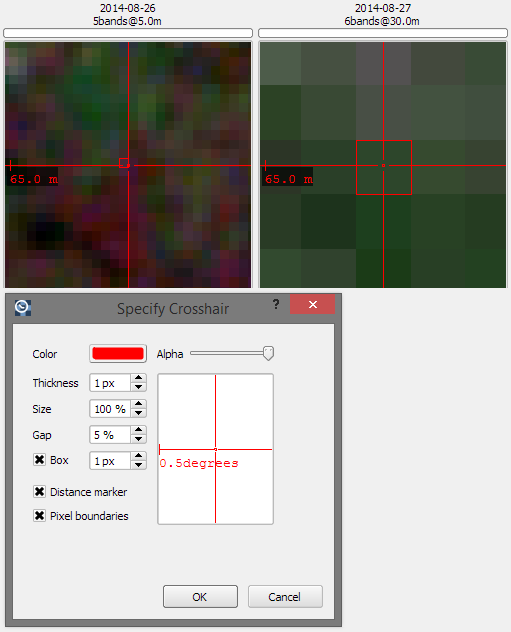
Fig. 5 Detailed and fully customizable crosshair with pixel highlighting and scale bar
Restore Workbench
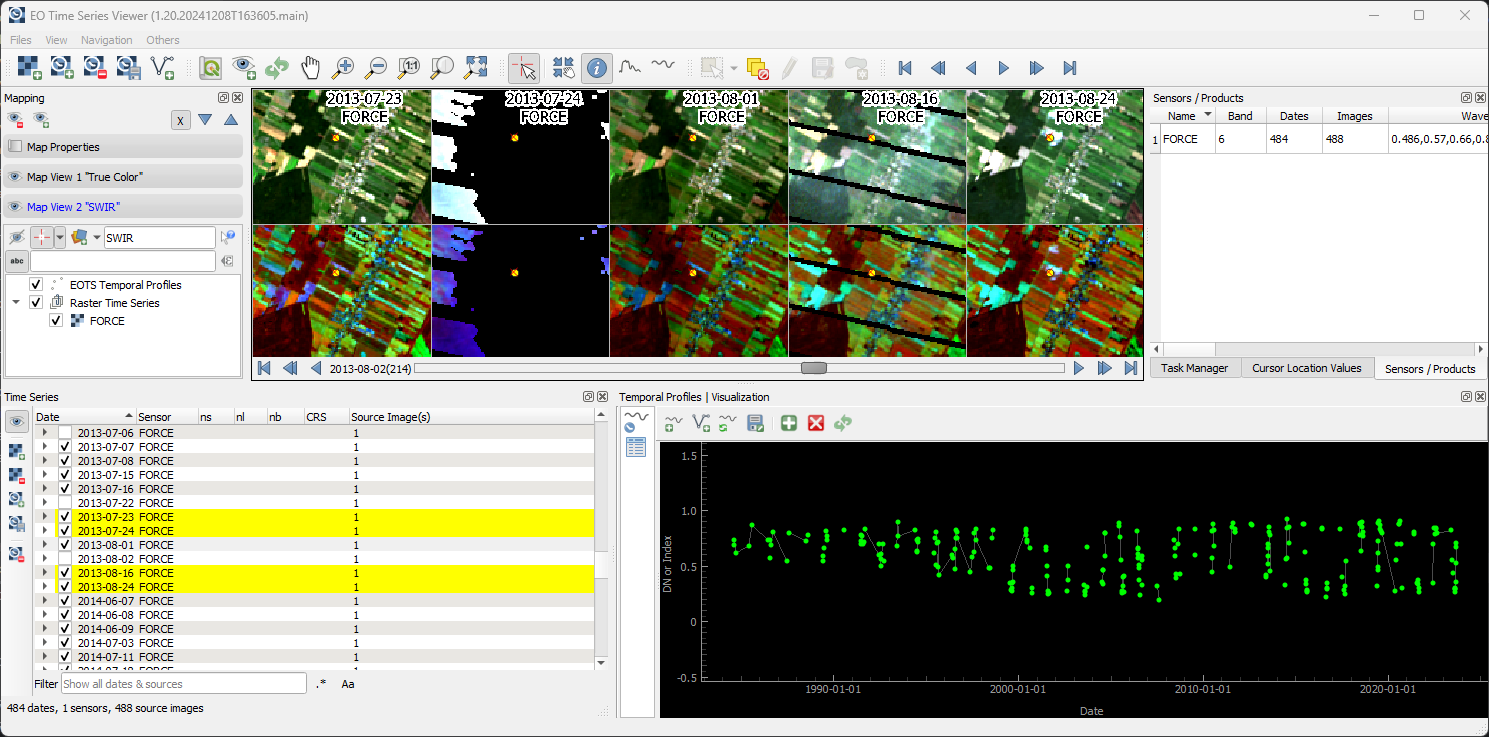
Fig. 6 Save and restore the EOTSV workbench inside a QGIS Project file.
Import FORCE Datasets
Import products from the datacube folders created with the Framework for Operational Radiometric Correction for Environmental monitoring (FORCE).
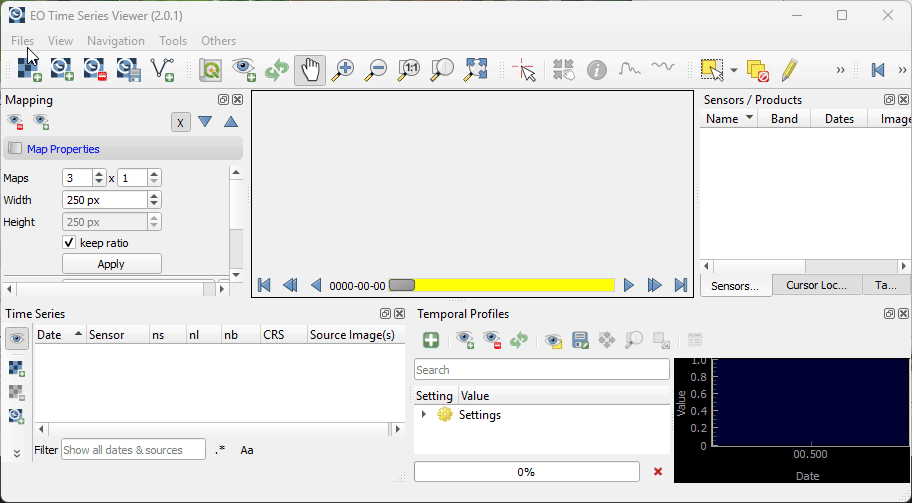
Fig. 7 Load images from a FORCE data cube and show a temporal profile.