7. Spectral Profiles
Warning
This section is outdated and currently being revised.
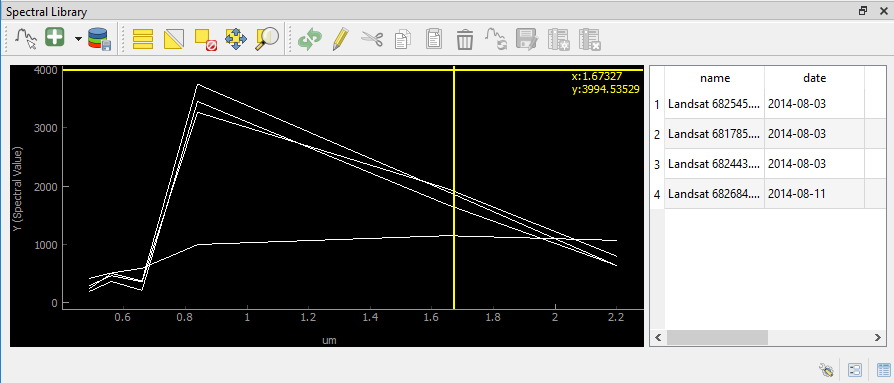
The spectral profile panel allows you to collect, visualize, label and export spectral profiles.
Use the
 Select a spectrum from a map button to extract and visualize a pixels profile
(by clicking on a pixel on the map).
Select a spectrum from a map button to extract and visualize a pixels profile
(by clicking on a pixel on the map).You can add a selected spectrum to your spectral library by clicking on
 .
.The gathered spectra are listed in the table on the right. For every spectrum additional metadata will be stored, e.g. the date, day of year and sensor.
When the
 button is activated, the profile will be directly added to the library after clicking on a pixel.
Change the display style (color, shape, linetype) in the Spectral Library Properties, which can be accessed via the
 button in the lower right.
Note
- The spectral library table behaves quite similar to the attribute table you know from QGIS:
You can edit the content by entering the editing mode

You can add further information by adding fields via the
 button (e.g. different class labels).
Remove them with
button (e.g. different class labels).
Remove them with  , accordingly.
Double-click into a desired field to change its content
Remove spectra by selecting the desired row(s) in the table and click
